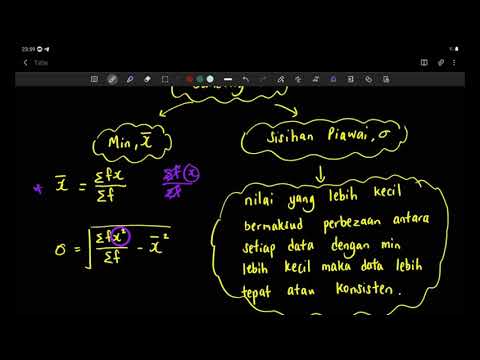
Chapter 7 : Sukatan Serakan Data Terkumpul
What will you learn in this chapter

Topics in this chapter
Quick Notes

Tebus eVoucher
Tebus ganjaran untuk meghargai kerja keras anda
Learn more »Live Tuition Recordings


REVISION PART 4: 2023 SPM TRIAL QUESTIONS (SET OPERATION)
Tutor: Miss Jannah
Thursday
19 Sep 2024
08:00 pm
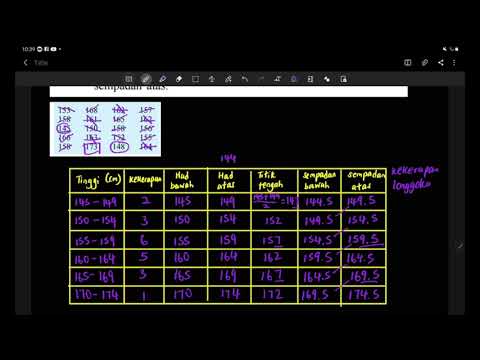
CHAPTER 7: MEASURE OF DISPERSION OF GROUPED DATA (PART 3)
Tutor: Miss Jannah
Thursday
22 Aug 2024
08:00 pm
CHAPTER 7: MEASURE OF DISPERSION OF GROUPED DATA (PART 2)
Tutor: Miss Jannah
Thursday
15 Aug 2024
08:00 pm
CHAPTER 7: MEASURE OF DISPERSION OF GROUPED DATA (PART 1)
Tutor: Miss Jannah
Thursday
08 Aug 2024
08:00 pm
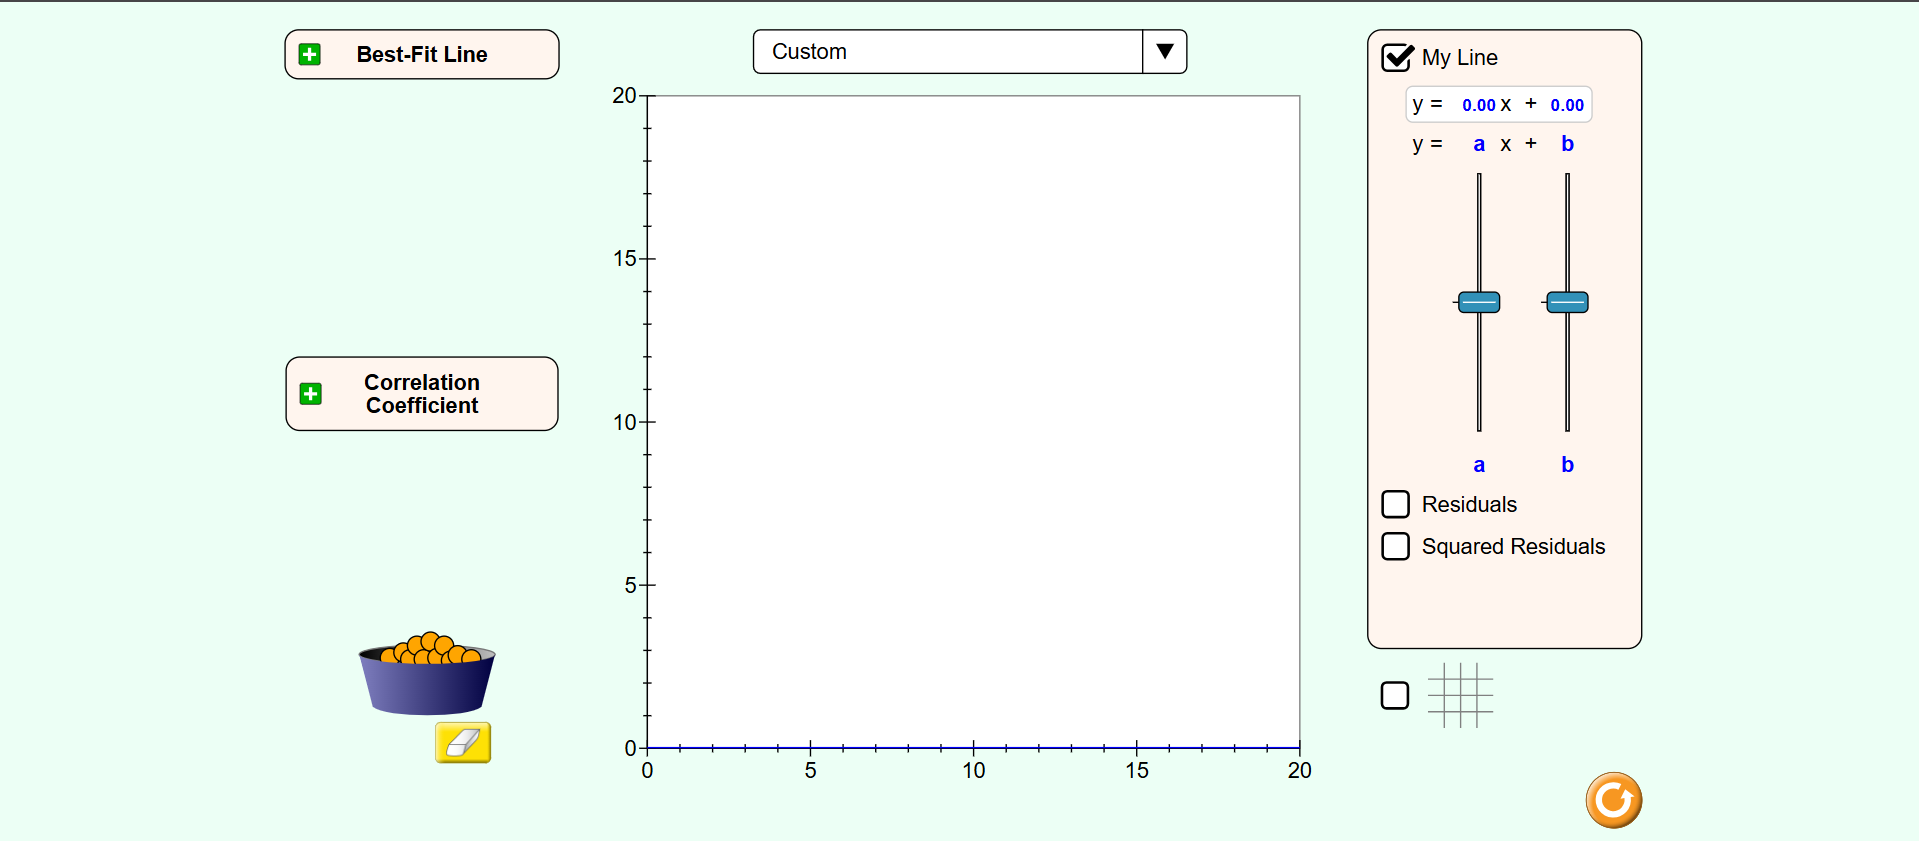
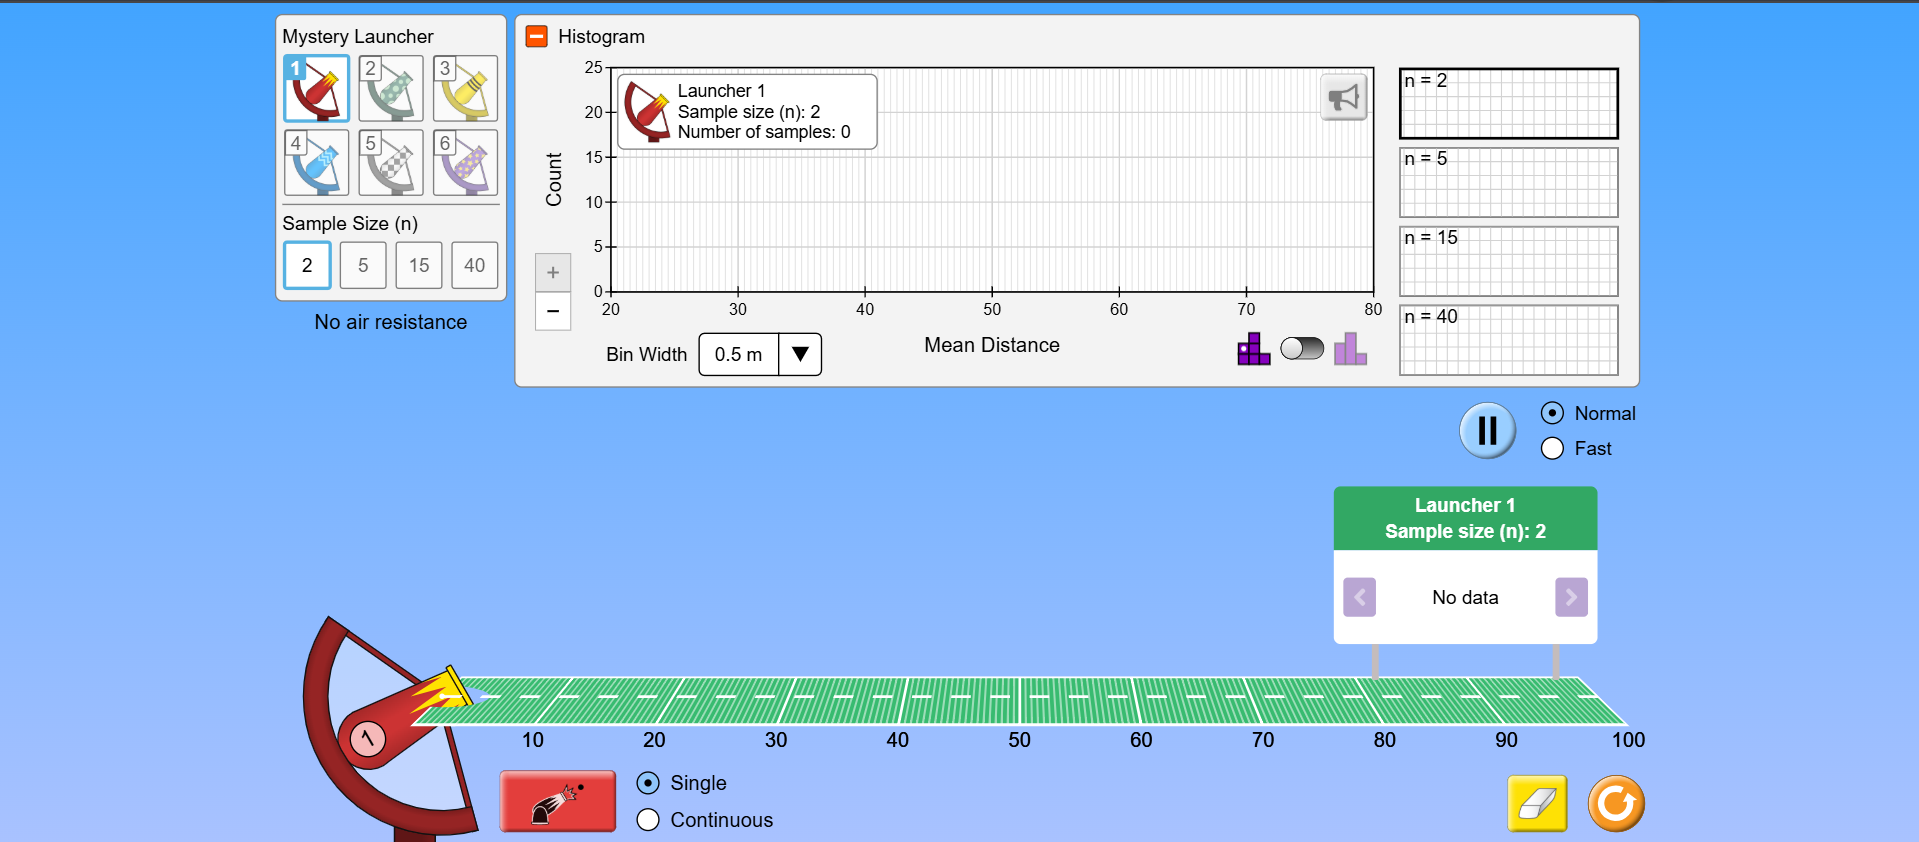
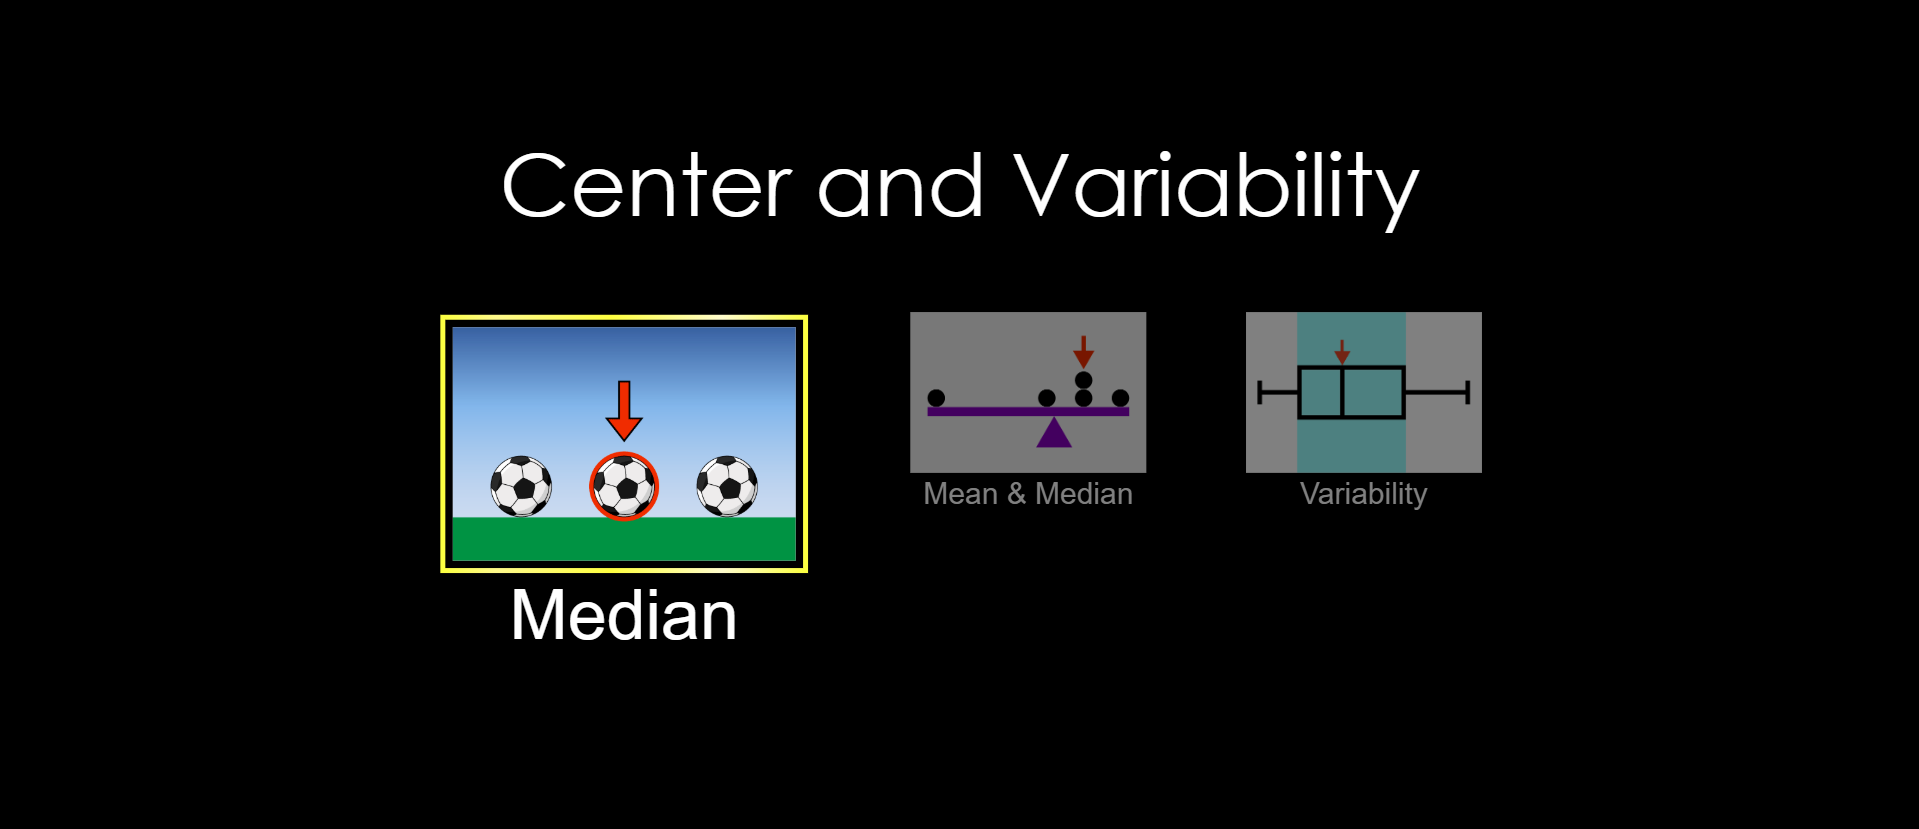
Experiments
Videos
Practices for this chapter
-
Flashcard
- Sukatan serakan