Serakan
Apa yang anda perlu pelajari dalam topik ini
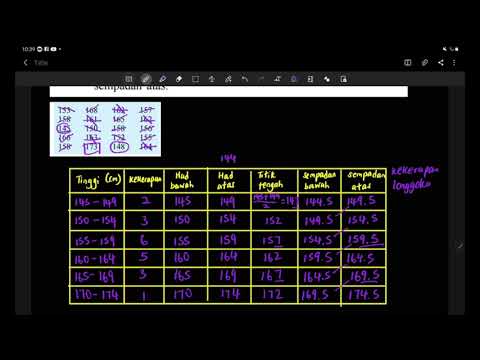
- Membina histogram dan poligon kekerapan bagi suatu set data terkumpul
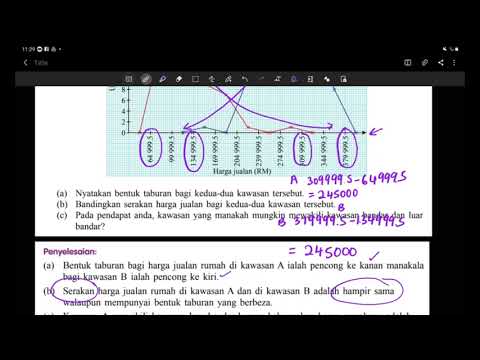
- Membanding dan mentafsir serakan dua atau lebih set data terkumpul berdasarkan histogram dan poligon kekerapan dan seterusnya membuat kesimpulan
- Membina ogif bagi suatu set data terkumpul dan seterusnya menentukan kuartil
Nota Ringkas
Live tuition recordings

REVISION PART 4: 2023 SPM TRIAL QUESTIONS (SET OPERATION)
Tutor: Miss Jannah
Khamis
19 Sep 2024
08:00 pm

CHAPTER 7: MEASURE OF DISPERSION OF GROUPED DATA (PART 3)
Tutor: Miss Jannah
Khamis
22 Aug 2024
08:00 pm
CHAPTER 7: MEASURE OF DISPERSION OF GROUPED DATA (PART 2)
Tutor: Miss Jannah
Khamis
15 Aug 2024
08:00 pm
CHAPTER 7: MEASURE OF DISPERSION OF GROUPED DATA (PART 1)
Tutor: Miss Jannah
Khamis
08 Aug 2024
08:00 pm