7.1 Distance-Time Graphs
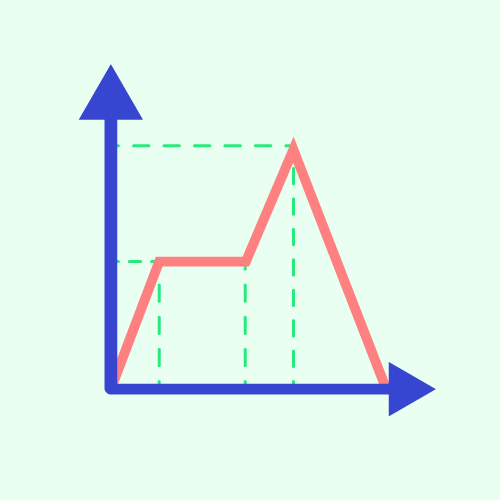
A distance-time graph represents the motion of an object over time in graphical form. On this graph, the vertical axis represents distance, while the horizontal axis represents time. The gradient of the graph represents the rate of change in distance with respect to time, which is speed. Understanding distance-time graphs helps us visualise journeys, determine whether an object is moving at uniform speed, stationary, or returning to its starting point, and calculate overall average speed.
Learning Objectives
- Draw distance-time graphs based on distance-time tables and equations representing the relationship between distance and time.
- Interpret distance-time graphs and describe the motion based on the graphs.
- Solve problems involving distance-time graphs, including calculating duration, distance, speed, and average speed.
Shape and Interpretation of a Distance-Time Graph
See how different line segments show motion moving forward, stationary, and returning to the starting point.
Brief Explanation
What is a Distance-Time Graph?
A distance-time graph tracks where an object is at any given point in time. The vertical axis measures distance, and the horizontal axis measures time.
What does the gradient show?
The steepness or gradient of the straight line shows the speed: a steeper line means a faster speed, while a horizontal line means zero speed.
Key Formula
\(\text{Gradient} = \dfrac{\text{Vertical distance}}{\text{Horizontal distance}} = \dfrac{\text{Difference in distance travelled}}{\text{Corresponding difference in time}}\)
\(\text{Speed} = \dfrac{\text{Distance}}{\text{Time}}\)
Units of speed often used include \(\text{km h}^{-1}\), \(\text{m s}^{-1}\), and \(\text{cm s}^{-1}\).
| Gradient | Meaning | Motion |
|---|---|---|
| Positive | Distance increases as time increases | Moving forward at uniform speed |
| Zero | Distance does not change as time passes | Stationary (at rest) |
| Negative | Distance decreases as time increases | Moving in the opposite direction / returning to start |
Average Speed
\(\text{Average speed} = \dfrac{\text{Total distance}}{\text{Total time}}\)
Useful formulas: \(\text{Distance} = \text{Speed} \times \text{Time}\) and \(\text{Time} = \dfrac{\text{Distance}}{\text{Speed}}\).
Try Answering First
Read the question, answer it in your mind, then press “Check Answer”.
What does the gradient of a distance-time graph represent?
On a distance-time graph, what does a horizontal line segment parallel to the time axis indicate?
A car travels a total distance of \(150\text{ km}\) in \(2\text{ hours}\). Calculate the average speed of the car in \(\text{km h}^{-1}\).
Drawing and Reading Distance-Time Graphs
From a table to a graph, and calculating speed, stationary time and average speed from a scaled graph.
Drawing a distance-time graph from a table
Choose a suitable scale for both axes, plot each pair of values, then join the points with a ruler. If every segment has the same gradient, all the points lie on one straight line.
| Time (minutes) | 0 | 30 | 60 | 90 | 120 |
|---|---|---|---|---|---|
| Distance (km) | 0 | 10 | 20 | 30 | 40 |
Check the gradient
For each 30-minute interval the distance increases by 10 km, so the gradient \(= \dfrac{10}{30} = \dfrac{1}{3}\) km per minute \(= 20\) km h\(^{-1}\). Because the gradient is the same for every interval, the graph is a single straight line through the origin and the motion is at uniform speed.
Reading and calculating from a distance-time graph
Mr Tan drives from Seremban to Rawang, stops for lunch, then continues to Lumut. The scaled graph below shows his journey.
Every segment is read straight off the scale: \((0, 0) \to (1.5, 100) \to (2.5, 100) \to (5, 300)\).
Common Mistakes
- Forgetting to convert units of time, for example using minutes directly instead of converting to hours when the required unit of speed is \(\text{km h}^{-1}\).
- Confusing distance travelled with position: reading the vertical coordinate as distance travelled in a segment rather than calculating the difference \((s_2 - s_1)\).
- Calculating total distance for a return trip incorrectly by subtracting instead of adding the distances of each leg of the journey.
- Averaging the speeds of individual sections directly by adding them and dividing by 2, instead of using \(\dfrac{\text{Total distance}}{\text{Total time}}\).
Misconceptions
A downward-sloping line on a distance-time graph means the object is decelerating or slowing down.
On a distance-time graph, a downward-sloping straight line indicates a negative gradient, which means the object is moving with uniform speed in the opposite direction or returning to the starting point, not decelerating.
The line on a distance-time graph represents the physical hill or road the vehicle is driving on.
The graph is an abstract plot of distance against time; a flat line means stopping in time, not driving on a flat road.
Summary
- In a distance-time graph, distance is plotted on the vertical axis and time on the horizontal axis.
- The gradient represents speed: \(\text{Speed} = \dfrac{\text{Distance}}{\text{Time}}\).
- A positive gradient indicates uniform motion away from the origin; a horizontal line (zero gradient) indicates the object is stationary; a negative gradient indicates motion in the opposite direction / returning to the start.
- Average speed is calculated as \(\text{Average speed} = \dfrac{\text{Total distance}}{\text{Total time}}\).
- When solving problems, always verify and match units between time (hours, minutes, seconds) and distance (km, m, cm).
Short Activity
Complete all parts first, then press the check answer button.
A. Objective Quiz
1 What does a horizontal line on a distance-time graph indicate about an object's motion?
2 A cyclist travels \(20\text{ km}\) in \(30\text{ minutes}\). What is the speed of the cyclist in \(\text{km h}^{-1}\)?
B. Fill in the Blanks
3 The gradient of a distance-time graph represents the rate of change in distance with respect to time, which is .
4 The formula to calculate average speed is total distance divided by .
C. Drag and Drop: Match Graph Features to Their Meanings
Drag each feature to the correct interpretation. On a phone, tap the answer choice first, then tap the matching box.