| Types of Measures of Central Tendencies |
|
| |
|
|
|
|
| (i) |
|
Mode |
|
| |
|
|
|
|
| (ii) |
|
Median |
|
| |
|
|
|
|
| (iii) |
|
Mean |
|
| |
|
|
|
|
| Mode, mean and median for a set of ungrouped data: |
|
| |
|
|
|
|
| Mode |
|
| |
|
| Definition |
| |
|
The mode of a set of data is the highest value of its frequency.
|
|
|
| |
|
- Sometimes there are two modes in a set of data where the highest frequency is equal.
- When the frequency of a set of data is the same, then the set of data is to be said no mode.
|
|
| |
|
|
|
|
| Median |
|
| |
|
|
|
|
| |
Definition |
|
| |
|
|
| |
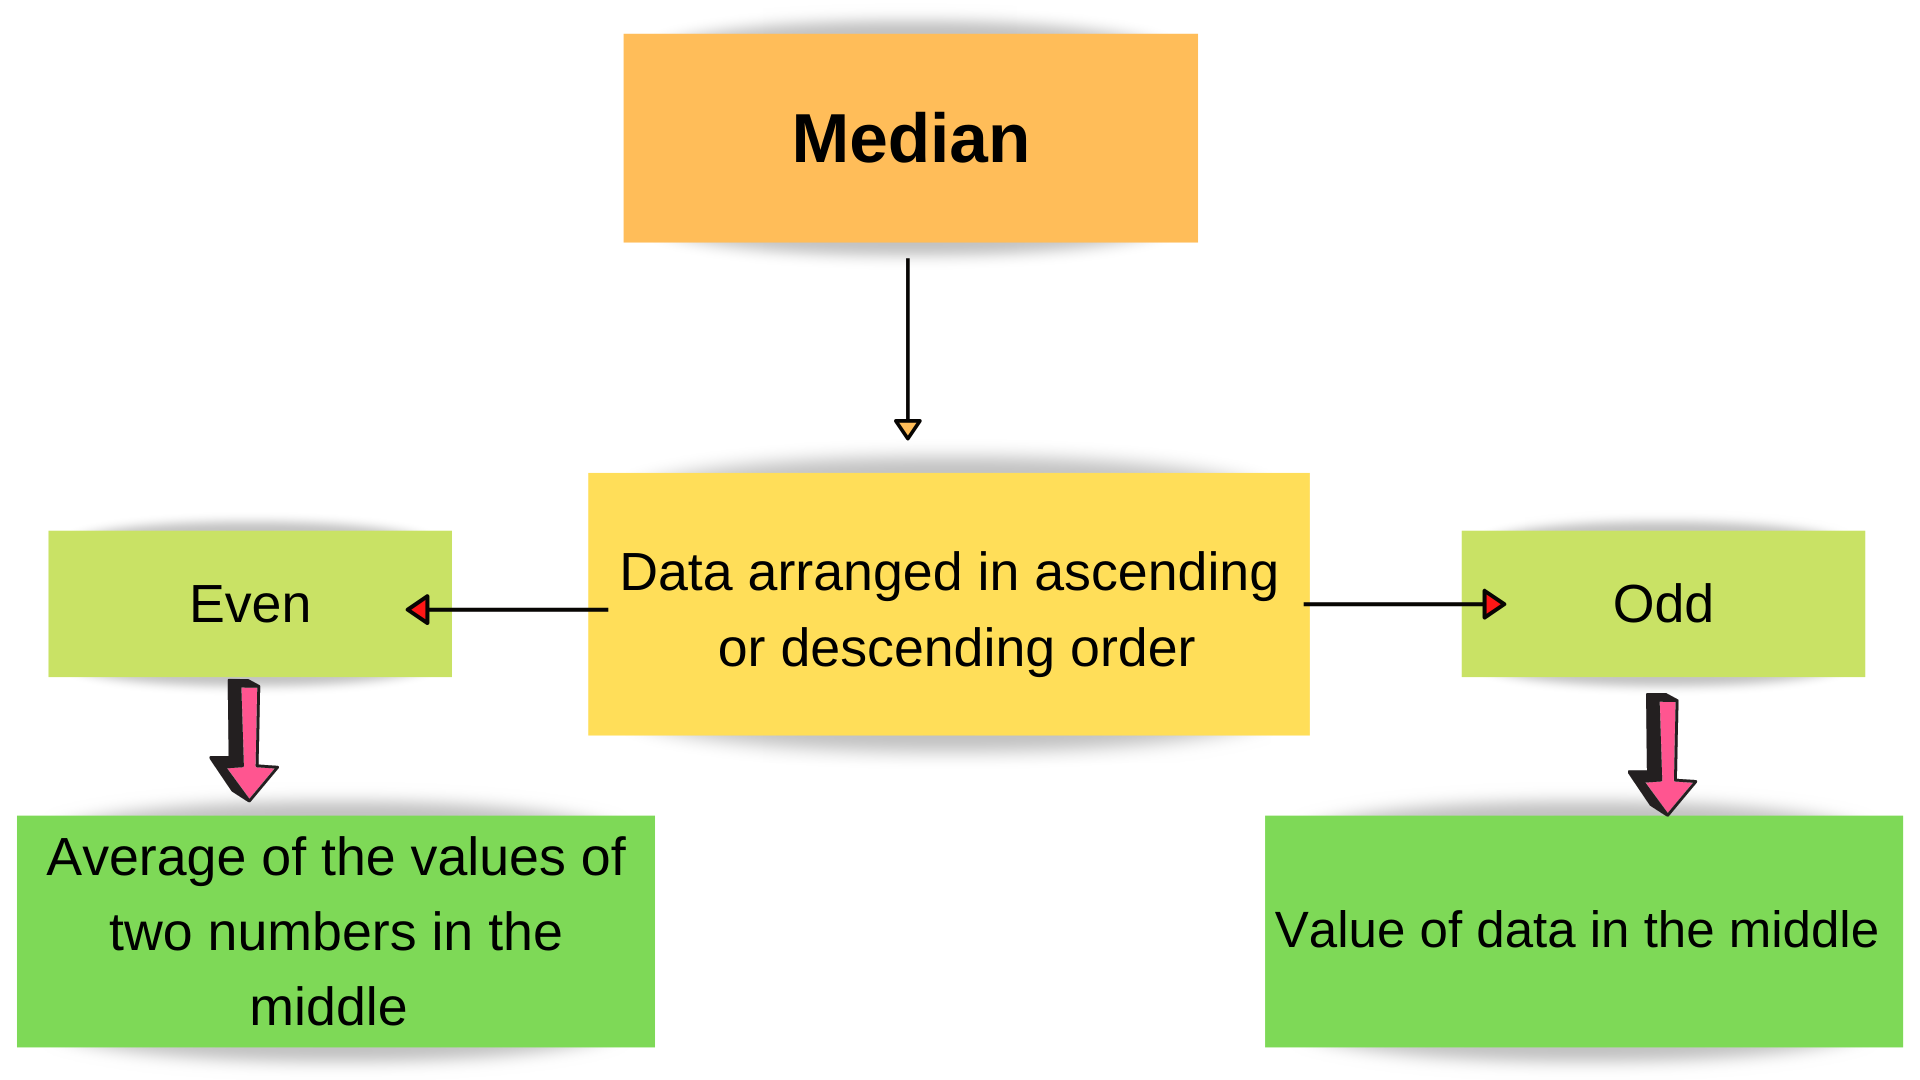
- The median for a set of data with an odd number of items is the value in the middle.
- The median for a set of data with an even number of items is the average value of two numbers in the middle arranged in ascending or descending order.
|
|
|
|
| |
|
 |
|
| |
|
| Formula |
|
| |
|
| For even data: |
|
| |
|
|
Average data at position
\(\bigg[\bigg(\dfrac{n}{2}\bigg)^\text{th}\text{ and }\bigg(\dfrac{n}{2} + 1\bigg)^\text{th}\bigg]\)
|
|
| |
|
| For odd data: |
|
| |
|
| Data at the position \(\bigg(\dfrac{n +1}{2} \bigg)^\text{th}\) |
|
| |
|
| Mean |
|
| |
|
| Definition |
| |
|
Mean for a set of data is the value obtained when the sum of the data values is divided by the number of data.
|
|
|
| |
|
| Formula |
|
| |
|
| \(\text{Mean}= \dfrac{\text{Total value of data}}{\text{Number of data}}\) |
|
| |
|
| Mean for the data in the frequency table: |
|
| |
|
| \(\text{Mean}= \dfrac{\text{Sum (data}\times\text{frequency)}}{\text{Number of frequencies}}\) |
|
| |
|
| Extreme Value |
|
| |
|
| Definition |
| |
- A value that is too small or too large in a set of data.
- It means the value is too far from the value of the other data in the set.
|
|
|
| |
|
| The effect of changing a set of data to the mode, median and mean: |
|
| |
|
- A uniform change in data will result in a uniform change in values for mean, median and mode.
- However, if the data is changed in a non-uniform manner, the values of mean, median and mode will also change in a non-uniform manner.
|
|
| |
|
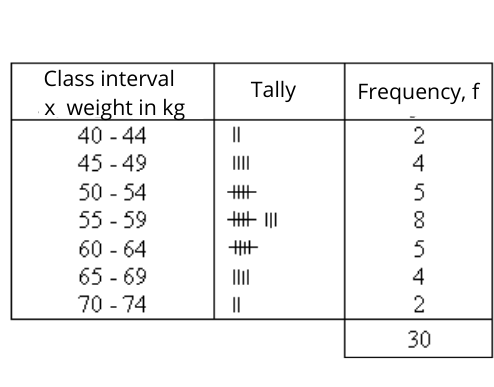
| Organise data in frequency tables for grouped data: |
|
| |
|
- To ensure the data is classified with a uniform class interval.
- To prevent the data from overlapping.
- To categories those data into appropriate groups and help to make a conclusion.
|
|
| |
|
| Example |
|
| |
|
|
|
|
| |
|
| Modal class and mean of a set of grouped data: |
|
| |
|
| Mean for grouped data: |
|
| |
|
|
\(\text{Mean} \\\\= \dfrac{ \text{The sum (frequency}\times\text{midpoint)}}{\text{Number of frequencies}}\)
|
|
| |
|
| The most appropriate measure for central of tendencies: |
|
| |
|
| Mean |
| |
|
- Selected to represent data when it involves the whole data when the extreme value does not exist.
|
| |
|
| Median |
| |
|
- Selected to represent the data when extreme values exist.
- It is not influenced by extreme values.
|
| |
|
| Mode |
| |
|
- Selected to represent data when we intend to determine the item with the highest frequency.
- Involves category data.
|
|
|