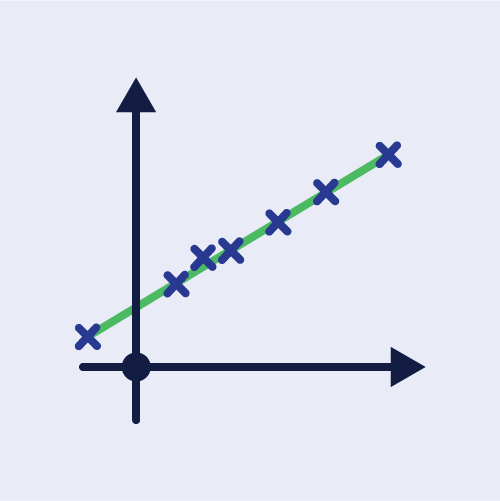
6.1 Linear and Non-Linear Relations
In scientific experiments and mathematical modelling, data collected for two related variables often does not display an immediate straight-line relationship when plotted in their original forms. This topic introduces the distinction between linear and non-linear relations, the technique of drawing a line of best fit, determining its equation in the linear form \(Y = mX + c\), and interpreting values through interpolation and extrapolation.
Learning Objectives
- Differentiate between linear and non-linear relations based on tables of data and graphs.
- Draw lines of best fit for graphs of linear relations by hand or using digital tools such as Desmos software.
- Form equations of lines of best fit in the form \(Y = mX + c\) using the gradient and \(Y\)-intercept.
- Interpret information from lines of best fit to predict values of variables by reading from graphs or by extrapolation/calculation.
Characteristics of a Line of Best Fit and Equation Derivation
Identify the correct distribution of points on both sides of a line of best fit and understand how the gradient \(m\) and \(Y\)-intercept \(c\) relate to the linear equation \(Y = mX + c\).
Correct Line of Best Fit
Points pass through several coordinates and stray points are balanced equally above and below the line.
Incorrect Line of Best Fit
All stray points lie on only one side of the line, so the line does not represent the data fairly.
Annotated Axes and Gradient Triangle
The vertical axis is \(Y\), the horizontal axis is \(X\), the intercept is \(c\) at \(X = 0\), and the gradient is \(m = \dfrac{\Delta Y}{\Delta X}\).
Short Explanation
A relationship is linear if plotting one variable against another produces a straight line. If the plotted points form a curve, the relationship is non-linear.
Linear Relation
When plotted as a graph, data points form a straight line. It fits the general linear form \(Y = mX + c\), where \(X\) is the horizontal-axis variable, \(Y\) is the vertical-axis variable, \(m\) is the gradient, and \(c\) is the \(Y\)-intercept.
Non-Linear Relation
When plotted as a graph, data points form a curve rather than a straight line. A linear graph can be obtained when the variables plotted on the horizontal axis, vertical axis, or both are changed.
Transforming Non-Linear to Linear
For \(y = x^2 + 1\), plotting \(y\) against \(x\) yields a curve, whereas plotting \(y\) against \(x^2\) yields a straight line.
Line of Best Fit
A line of best fit is a straight line that joins most of the points plotted on the graph. Points that do not lie directly on the line must be distributed evenly on both sides of the straight line.
| Concept | Graph Form | Key Feature |
|---|---|---|
| Linear relation | Straight line | Fits \(Y = mX + c\) |
| Non-linear relation | Curve | Can become linear after changing axes variables |
| Line of best fit | Straight line through most points | Off-line points balanced evenly on both sides |
| Gradient \(m\) | Slope of the line | \(m = \dfrac{Y_2 - Y_1}{X_2 - X_1}\) |
| \(Y\)-intercept \(c\) | Point where the line cuts the vertical axis | Value of \(Y\) when \(X = 0\) |
Steps for Forming the Equation of a Line of Best Fit
Draw the line of best fit through the plotted points.
Choose two points \((X_1, Y_1)\) and \((X_2, Y_2)\) on the line.
Calculate the gradient \(m = \dfrac{Y_2 - Y_1}{X_2 - X_1}\).
Read or calculate the \(Y\)-intercept \(c\), then write \(Y = mX + c\).
Gradient of a straight line
\(m = \dfrac{Y_2 - Y_1}{X_2 - X_1}\)Use two points that lie on the drawn line of best fit.
General linear form
\(Y = mX + c\)\(m\) is the gradient and \(c\) is the \(Y\)-intercept.
Try to Answer First
Answer in your mind, then press "Check Answer".
A straight line graph is obtained by plotting \(\dfrac{1}{y}\) against \(\dfrac{1}{x}\). The line passes through the points \((1, 7)\) and \((19, 20)\). Find the gradient of the line.
State the condition that must be fulfilled by points that do not lie on the line of best fit.
A straight-line graph of \(\log_{10} y\) against \(x\) has a gradient of \(2\) and a vertical intercept of \(0.2\). Express the equation of the line of best fit in the form \(Y = mX + c\).
Common Mistakes
- Using plotted data points to calculate gradient instead of points on the line. Students often select pairs from the raw data table rather than coordinates lying directly on the drawn line of best fit.
- Uneven distribution of points. Drawing a line that simply connects the first and last data points, leaving all other points on one side of the line.
- Misidentifying the axes variables. Writing \(y = mx + c\) when the axes are actually transformed variables such as \(\dfrac{1}{y}\), \(x^2\), or \(\log_{10} y\).
- Incorrect scale reading. Miscalculating values when grid subdivisions do not represent simple unit increments, for example misreading \(0.1\) or \(0.2\) intervals on graph paper.
Concept Misunderstandings
A non-linear relation can never be represented by a straight-line graph.
A non-linear equation can produce a straight-line graph if the variables on the axes are appropriately transformed, for example plotting \(Y = y\) against \(X = x^2\) for \(y = x^2 + 1\).
The line of best fit must pass through every plotted experimental point.
Experimental data usually contains variations. The line of best fit needs to pass through as many points as possible while balancing the remaining points evenly on either side.
The line of best fit must always pass through the origin \((0, 0)\).
The line only passes through the origin if the \(Y\)-intercept \(c = 0\). In many relations, \(c \neq 0\).
Summary
- A linear relation yields a straight line with general form \(Y = mX + c\), where \(m\) is the gradient and \(c\) is the \(Y\)-intercept.
- A non-linear relation yields a curve when original variables are plotted, but can be converted into a linear graph by redefining the variables on the \(X\)-axis and/or \(Y\)-axis.
- A line of best fit joins the maximum number of plotted points, with off-line points distributed evenly on both sides.
- The equation of the line of best fit is established by determining \(m = \dfrac{Y_2 - Y_1}{X_2 - X_1}\) using two points on the line and finding the vertical intercept \(c\).
- Lines of best fit allow values of variables to be determined via interpolation, reading within data range, or extrapolation, reading outside data range or calculating via the equation.
Short Activity
Objective: Identify linear and non-linear relations, lines of best fit, gradients, intercepts and key terms in linear law.
A. Objective Quiz
1 What is the primary defining characteristic of the points that do not lie directly on a drawn line of best fit?
2 When plotting the equation \(y = x^2 + 1\), which graph produces a linear relation?
B. Fill in the Blanks
3 For a linear graph representing \(Y = mX + c\), \(m\) represents the ________ of the line.
4 The intersection point of a straight line with the vertical axis is known as the ________.
C. Matching / Drag and Drop
Drag each term to the correct meaning. On a phone, tap a term first, then tap the matching box.