| |
|
6.2
|
The Graphs of Sine, Cosine and Tangent Functions
|
|
| |
|
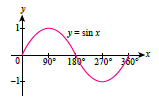
The characteristics of sine graph, \(y = \sin x\):
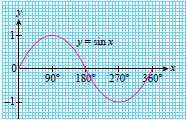
- has a maximum value of 1 when \(x = 90^\circ\) and a minimum value of –1 when \(x = 270^\circ \)
- intercepts \(x\)-axis at \(x = 0^\circ,180^\circ,360^\circ \) (\(x\)-intercept)
- intercepts -axis at \(y=0\) ( \(y\)-intercept)
|
| |
|
The characteristics of cosine graph, \(y = \cos x\):
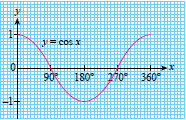
- has a maximum value of 1 when \(x = 0^\circ\) and \(x = 360^\circ\) and a minimum value of –1 when \(x = 180^\circ\)
- intercepts \(x\)-axis at (\(x\)-intercept)
- intercepts \(y\)-axis at y = 1 (\(y\)-intercept)
|
| |
|
The characteristics of tangent graph, \(y = \tan x\):
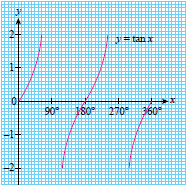
- maximum value is \(\infty\) and minimum value is \(-\infty\)
- intercepts \(x\)-axis at \(x = 0^\circ,180^\circ,360^\circ \) (\(x\)-intercept)
- intercepts \(y\)-axis at \(y=0\) ( \(y\)-intercept)
- the values of \(\tan90^\circ\) and \(\tan 270^\circ\) are undefined
|
| |
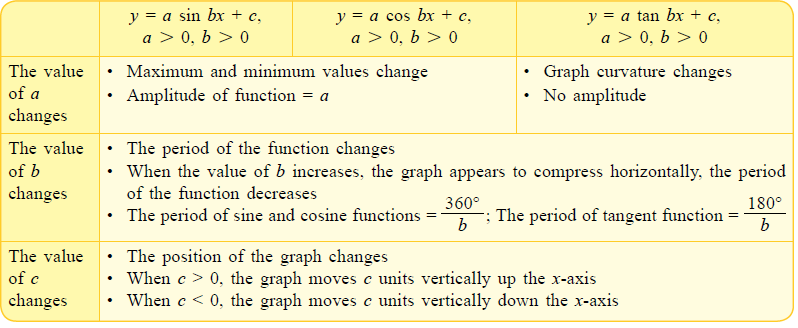
| The effects of changes in constants a, b and c on the graphs of trigonometric functions y = a sin bx + c, y = a cos bx + c and y = a tan bx + c |
| |
 |
| |
|
|
| |
| Example 5 |
| |
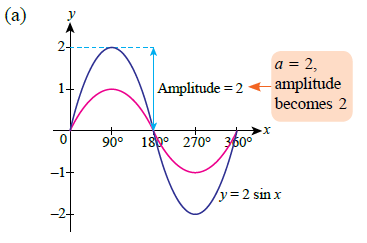
| The diagram below shows a graph of the function \(y = \sin x \text{ for } 0^\circ \leq x \leq 360^\circ\). Sketch each of the following trigonometric functions on the same axes. |
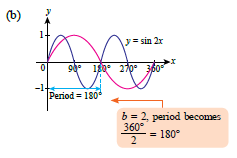
(a) \(y = 2 \sin x \) (b) \(y=\sin 2x\)
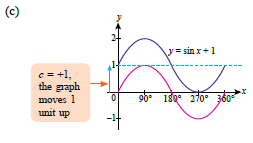
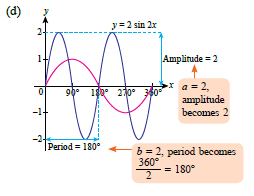
(c) \(y = \sin x + 1\) (d) \(y = 2 \sin 2x\) |
| |
 |
| |
| Solution: |
| |
  |
| |
 |
| |
 |
| |
 |
| |
|
|